Group Gordon’s Lillian Nottingham blogs about the dominance of data and how to make the numbers work for you. 4.16.2015
Data. The crush of information collected both on- and offline grows every minute. New analyses and reporting have provided evidence of things we have always assumed to be true (A third of social media users has used it to check up on an ex) and unveiled shocking statistics (one in 10 Americans has never sent an email. Ever.).

Numbers are powerful. When used for good, they can be especially useful to crystalize a fine point, provide unique insight, or convey a tangible impact. But when used incorrectly, they can be misleading, leading to faulty reporting, mistrust, or a crisis.
Translating data into a well-articulated – and correct! – story can be a tough assignment, but it’s one that has become increasingly necessary in PR. But before you send your next email in binary, here are some best practices for communicating data accurately and effectively:
1. Curate it
In PR, clear and concise messaging is key. This rule of thumb applies especially when communicating data: highlight only the few most interesting figures. While you may have dozens of fascinating data points and graphs to offer, including it all in a first pass will overwhelm and bury what’s newsworthy rather than impress. Curate your data to present the best topline data upfront, even including it in a pitch’s subject line to grab attention
2. Interpret it (correctly!)
We’ve all seen headlines like these: “Mainers who eat less butter are less likely to get divorced!”
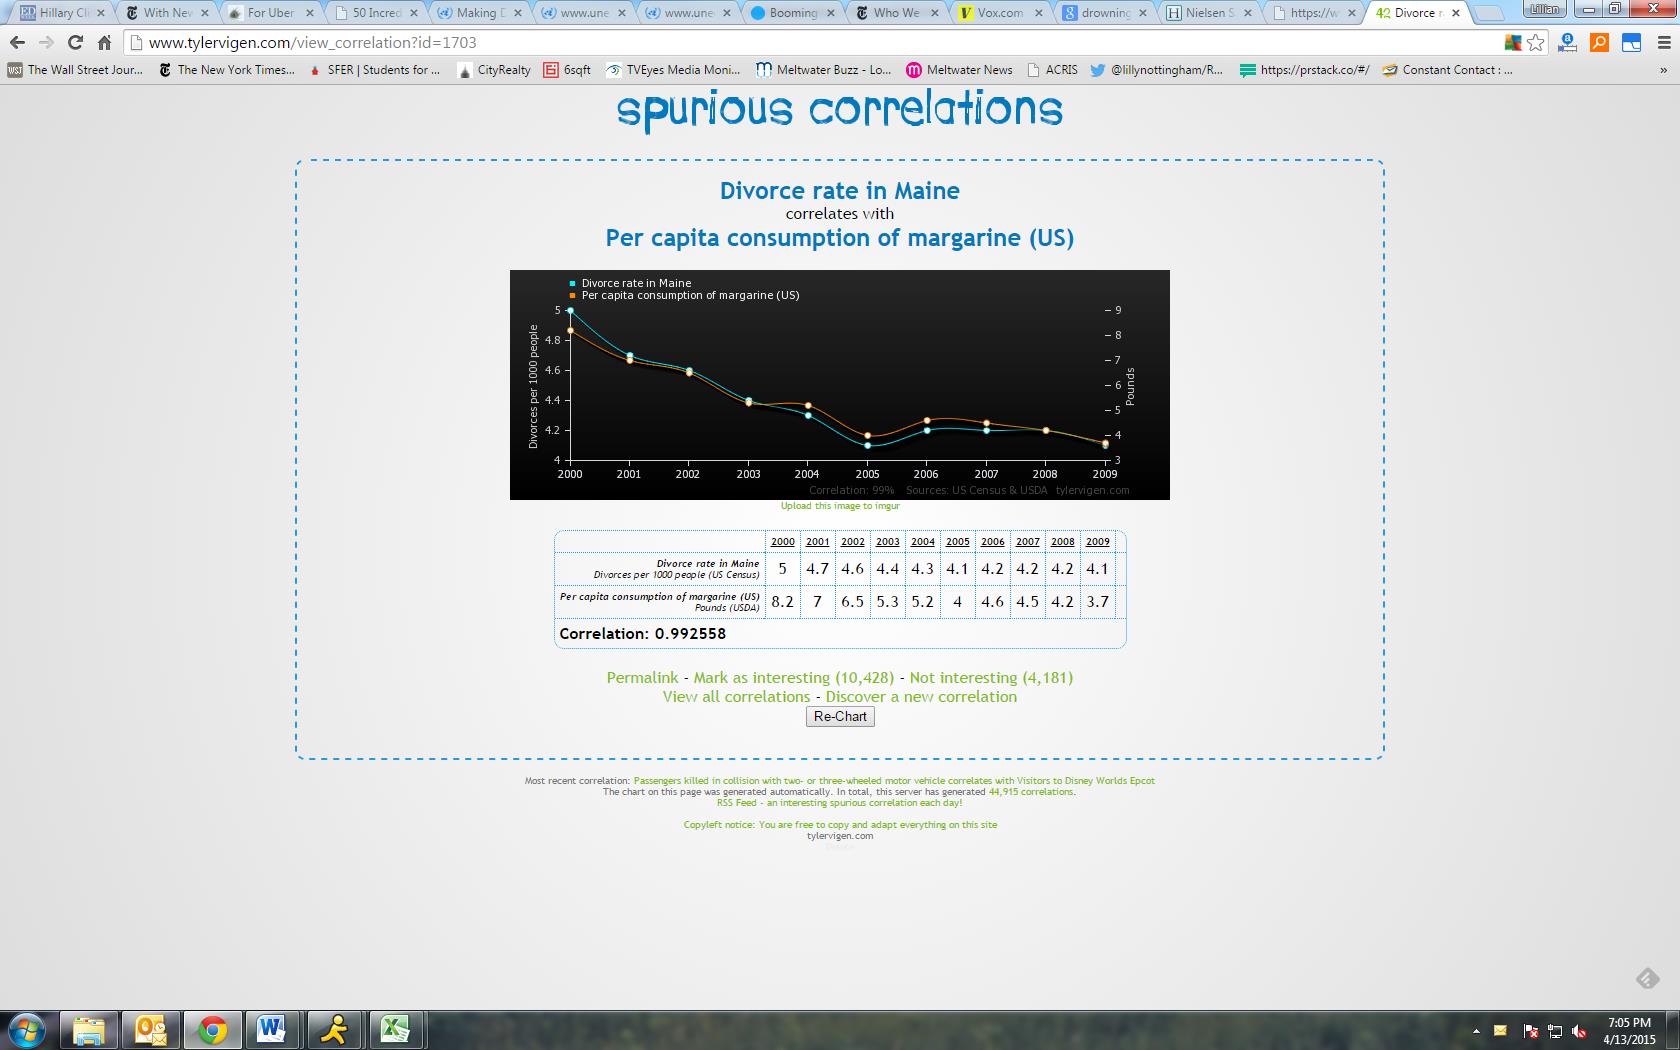
But, as the mantra of introductory statistics courses goes, “correlation does not imply causation.” Too often, complex data is condensed and confounded in the effort to emphasize what’s newsworthy. Seemingly innocuous but murky conclusions written in a short email suddenly become public fact, leading people to believe things like cheaper weddings really result in happier marriages.
Don’t feed the Spurious Correlation beast! Be as precise writing with numbers as with words: pay close attention to how the data is collected, interpreted, and framed and always be transparent about methodology.
3. Contextualize it
$14.4187 trillion dollars is lot of money. With $14.4187 trillion you could give away new cars to every person in the United States and still have plenty of money left over to go on every dream vacation you’ve ever wanted.

But $14.4187 trillion was also the annual GDP of the U.S. in 2009, a year that marked one of the most severe economic contractions in the U.S. in decades: a decline of 2% or close to $300 billion in one year.
Context matters. A number, without being couched in a historical trend or juxtaposed against another metric, is just a number. Decide which numbers will convey the big-picture story to reporters. Does providing an absolute term make the most sense, or is percent-change more illustrative of what’s really going on?
4. Visualize it
Translating raw figures into visuals can be a powerful way to communicate data to a broader audience. Charts can provide a snapshot of a single moment or tell a story of how a metric has changed over time. Infographics can be an especially useful tool, offering journalists and readers a quick and detailed visual narrative with multiple measures and data points.
5. Live it
For some, Excel spreadsheets evoke a sense of dread rather than excitement. Take heart! When used correctly, data can be a PR person’s dream. Immerse yourself in quantitative reporting to develop a “data antenna” for what numbers are newsworthy and who reports on them, including great data-centric news sources like FiveThirtyEight and its daily newsletter Significant Digits, which collects the most notable numbers in the news; The Upshot blog from The New York Times; and Pew Research Center, which provides unbiased research and newsletters on a variety of issues, attitudes, and trends shaping America and the world.
At the end of the day, balance being numbers-savvy with being communications-savvy. Then you’ll be on your way to transforming datasets into newsworthy stories…the right way!
